| |
Stephen Amoah

The GGHA Highest Honorary Title “World Harmony Gandhian Creator”, 2019 Gallery: In English: http://peacefromharmony.org/?cat=en_c&key=513 In Russian: http://peacefromharmony.org/?cat=ru_c&key=543
GHA Ambassador of Peace and Disarmament from Harmony in Ghana, GHA-Africa Board Member, MSc Statistics, PhD Applied Statistics, Ghana Statistical Service (GSS), Head of Statistical Coordination and Capacity Building Unit, Home address: Accra, Ghana Web: http://peacefromharmony.org/?cat=en_c&key=837
----------------------------------------------------------------------------------------------------

For BRICS+ The African Peacemaking Spherons Statistical Proof and Verification By Stephen Amoah
The addition into GGHA „Gandhian Spheronics for BRICS+“ Message and Project: https://peacefromharmony.org/?cat=en_c&key=1152
The addition publication in English and Russian: https://peacefromharmony.org/?cat=en_c&key=837 What are the common, universal and peacemaking actors for all BRICS countries and humanity as a whole, capable to raise them to a new level of development? The first scientific answer to this fundamental question was given by Mahatma Gandhi in 1927 with his concept of “Newtonian varna-spherons”. He wrote: “Varna is not a human invention, but an immutable law of nature - the statement of tendency that is ever present and at work like Newton's law of gravitation. Just as the law of gravitation existed even before it was discovered so did the law of Varna... Varna has nothing to do with caste… Varna has nothing to do with caste… It is the law of life that governs all humanity...” [1] (Varnas are communities of ancient India, and spherons are their analogues of modern humanity. [2]) The Gandhian concept of spherons, racistly rejected by the West, is for the global South countries, consolidated in BRICS+, the best theoretical paradigm of its sovereign philosophy and scientific ideology in justifying its strategic goals and ways to achieve them, which were proclaimed in the Johannesburg Declaration in August 2023 [3 ] and earlier [4]. The common goals of accelerated growth, prosperity, global peace and sustainable development in “inclusive multilateralism” are ensured by common actors for all countries - spherons, statistical verification and proof of which by world statistics are carried out in the GGHA book “Gandhica” [2]. Statistical verification of spherons was carried out in all countries using a single methodology tested for more than 20 years, an updated version of which is published here [5] and summarized in statistical Table-2. In it, traditional statistical indicators of two clusters: “Demography” and “Employment” were structured and aggregated into four spheral indices “spherons” of any territorial unit from a municipality to the country and humanity as a whole. Similarly, indices of “employed” personnel of any production institute were aggregated into four spheral indices of the “spherons”. As part of this international fundamental research, we conducted a statistical verification of the five African countries spherons, the result of which is presented in the book “Gandhica” [2, 47-51]. The spherons verification result of one of these countries, for Ghana, as a typical example, is presented in the table below. The full 13-page version of this study is published here [6]. I am a professional statistician, having acquired three degrees in statistics (BSc, Statistics, MSc Statistics and PhD in applied statistics) with professional experience at the Ghana Statistic Service since 1992, including the “Department of Statistical Coordination" Head. We with colleagues recognized the scientific nature of the spherons statistical verification methodology, conducted similar studies of five African countries in 2019 and received excellent results. These results are presented in the corresponding five statistical tables for these countries, which are published in Gandhica on the pages of the English edition [2, 47-51]. As a typical example, I reproduce here only the statistical table of Ghana's spherons for 3 years: 1984, 2000 and 2010: GHANA Spherons’ Statistics, 1984, 2000 & 2010, million people* By Stephen Amoah and Ayo Ayoola-Amale 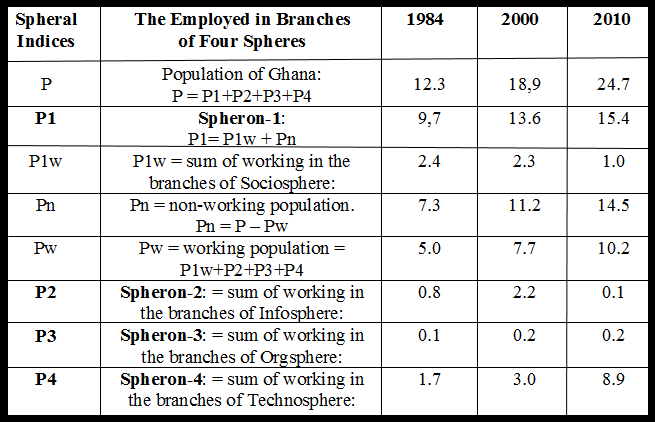
*The article full (13p.) publication [6] The statistical sources of our research are: [7; 8]. All statistical studies published in our book confirms the universality of this social reality, which incidentally is still unknown to official science i.e. the four spherons employed in the four spheres of social production at any of its social objects. It is unlikely that any other study can refute the existence of this objective reality, with its fundamental social significance. It can be interpreted in three key dimensions: Firstly, it is the reality of a single social structure at all levels of humanity, in all countries and societies at all times. Secondly, it is the reality of equal universal actors of social production, since they are equally necessary and together sufficient for it everywhere and always. Thirdly, it is the reality of global true/eternal peace, which, without them, cannot be attained any other private and historically transitory (class, national, sectoral, religious, party and other) actors and subjects of society. Furthermore, our research has shown the inadequate preparation and lack of equipment and professional statistical personnel to address the challenges, given their colossal labor intensity. These challenges, however, are solvable in conditions of appropriate special laboratories within the BRICS+ “Academy for Accelerated Growth and Peace” framework, offered by our project with a minimum annual funding of 2 million dollars for 30-40 specialists. The processes of spheral aggregation of traditional statistical indices into spheral indices can easily be automated within the framework of innovative digital technologies that we offer for BRICS+. New, spheral digital technologies will provide BRICS+ with new, global statistics in addition to traditional ones and open to countries the development of a fundamentally new direction of “Strong Artificial Intelligence of Global Statistics”. A pilot project has been created in the GGHA [9] and proposes to BRICS+. New technologies will avail to BRICS+ effective ways to implement its goals of accelerated growth and global peace. BRICS+ should not miss this historical opportunity to recognize the Gandhian spheronics as its scientific and theoretical basis on which these technologies were created. The best and fastest way to implement it is to create a small Academy of BRICS+ with many practical laboratories, as our project proposes. 1. Gandhi Mahatma. My Religion, 1955, Chapter 36: https://www.mkgandhi.org/my_religion/36varna_caste.htm 2. Semashko, L., GGHA. Mahatma Gandhi. Nonviolence Starting Point. Spherons’ Genetics and Statistics. GANDHICA. / Semashko. L. [et al.]. – New Delhi. R.B.H. Media Design. 2019. – 242 p. - URL: https://peacefromharmony.org/docs/gandhi-nonviolence-of-spherons-gandhica-2019.pdf. 3. Johannesburg II Declaration. BRICS and Africa: Partnership for Mutually Accelerated Growth, Sustainable Development and Inclusive Multilateralism, Sandton, Gauteng, South Africa, 23 August 2023: https://www.mid.ru/ru/foreign_policy/news/1901504/?lang=en 4. BRICS’s Priority: "To Strengthen of International Peace and Security". September 24, 2015: http://peacefromharmony.org/?cat=en_c&key=632 5. Leo Semashko, Olga Kashina. The Spherons Verification Methodology at Any Social Object in 2 Hours Within the Spheronics. Updated 2022:https://peacefromharmony.org/?cat=en_c&key=1125 6. Stephen Amoah and Ayo Ayoola-Amale. Ghana: Spherons’ Statistics, 1984, 2000 & 2010. 2019:https://peacefromharmony.org/?cat=en_c&key=836 7. Ghana Statistical Service. GSS (2012). 2010 Population and Housing Census Economic Activities in Ghana. 8. Ghana Statistical Service. GSS (2013) 2010 Population and Housing Census National Analytical Report. 9. Leo Semashko, Olga Kashina. Spheronics: Artificial Intelligence of Global Statistics and Russian Leadership. January 2023: https://peacefromharmony.org/?cat=en_c&key=1109 + Startup: https://peacefromharmony.org/docs/Заявка_Стартап_Утвержденный_С1ИИ-300867-3_Соткликом_05-02-23.pdf Dr. Stephen Amoah, GGHA-Africa Board Member, MSc Statistics, PhD Applied Statistics, Ghana Statistical Service (GSS) since 1992, Head of Statistical Coordination and Capacity Building Unit, Professional experience in statistics is more 30years, Web: https://peacefromharmony.org/?cat=en_c&key=837 Емайл. steveamoah@gmail.com Homeaddress: Accra, Ghana 03-10-23 --------------------------------
Стивен Амоа
Для БРИКС+:Статистическое доказательство и верификация миротворческих сферонов пяти стран Африки Дополнение к посланию-проекту: «Гандианская Сфероника для БРИКС+»: https://peacefromharmony.org/?cat=ru_c&key=1050 Публикация дополнения на английском и русском языках: https://peacefromharmony.org/?cat=en_c&key=837 Каковы общие, универсальные и миротворческие акторы всех стран БРИКС и человечества в целом, способные поднять их на новый уровень развития? На этот фундаментальный вопрос первый научный ответ дал Махатма Ганди в 1927 году своей концепцией «Ньютоновских варн-сферонов». Он писал: «Варны - это не создание человеческого ума, а непреложный закон природы, … подобный ньютоновскому закону всемирного тяготения… Варна не имеет ничего общего с кастой… Это закон жизни, который управляет всем человечеством». [1] (Варны – это общности древней Индии, а сфероны – их аналоги современного человечества. [2]) Гандианская концепция сферонов, расистски отвергнутая Западом, является для стран глобального Юга, консолидированных в БРИКС+, лучшей теоретической парадигмой его суверенной философии и научной идеологии в обосновании его стратегических целей и путей их достижения, которые провозглашены в Йоханнесбургской Декларации, в августе 2023 года [3] и ранее [4]. Общие цели ускоренного роста, процветания, глобального мира и устойчивого развития в «инклюзивной многосторонности» обеспечиваются общими для всех стран акторами - сферонами, статистическая верификация и доказательство которых мировой статистикой осуществлены в книге ГГСГ «Гандика» [2]. Статистическая верификация сферонов проводилась во всех странах по единой методике апробированной в течении более 20 лет, обновлённая версия которой опубликована здесь [5] и резюмированная ней в статистической Таблице-2. В ней традиционные статистические показатели двух кластеров: «Демография» и «Занятость» структурировались и агрегировались в четыре сферных показателя «Сфероны» любой территориальной единицы от муниципалитета до страны и человечества в целом. Аналогично, показатели «занятости» персонала любого производственного института агрегировались в четыре сферных показателя «Сфероны». В рамках данного международного фундаментального исследования мы провели статистическую верификацию сферонов пяти африканских стран, результат которой представлен в книге «Гандика» [2, 47-51]. Результат верификации сферонов одной из этих стран, для Ганы, как типичный пример, представлен таблицей ниже. Полная версия этого исследования на 13 страницах опубликована здесь [6]. Как профессиональный статистик, получив три степени в области статистики (бакалавр статистики, магистр статистики и доктор философии в области прикладной статистики) с опытом профессиональной работы в Национальном «Статистическом Агентстве Ганы» с 1992 года, в том числе, в качестве руководителя «Департамента Статистической Координации», признавая научность методики статистической верификации сферонов, провел с коллегами в 2019 году подобные исследования пяти Африканских стран и получил отличные результаты. Они представлены в соответствующих пяти статистических таблицах для этих стран на тот или иной период, которые опубликованы в «Гандике» на страницах: английского издания [2, 47-51]. В качестве их типичного примера я воспроизвожу здесь только статистическую таблицу сферонов Ганы за 3 года: Стивен Амоа и Айо Аола-Амале Гана. Статистика сферонов за 1984, 2000 и 2010 годы, млн. чел.* 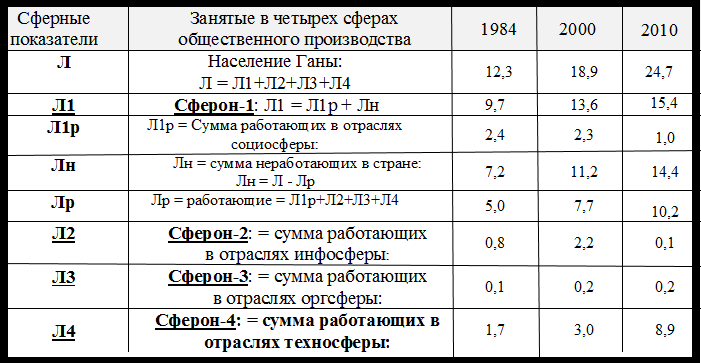
*Полная публикация статьи, 13 с. [6] Статистические источники нашего исследования: [7; 8]. Все статистические исследования, опубликованные в нашей книге подтвердили универсальность такой, пока неизвестной официальной науке, социальной реальности как четыре сферона, занятые в четырех сферах общественного производства на любых его социальных объектах. Вряд ли какое-либо иное исследование может опровергнуть существование этой объективной реальности, имеющей фундаментальное социальное значение. Ее значение можно интерпретировать в трех ключевых измерениях: 1. Это реальность единой социальной структуры на всех уровнях человечества, во всех странах и обществах во все времена. 2. Это реальность столь же универсальных и равных акторов общественного производства, поскольку они равно необходимы и вместе достаточны везде и всегда. 3. Это реальность единственных акторов глобального истинного/вечного мира, который, кроме них, не может быть достигнут никакими другими частными и исторически преходящими (классовыми, национальными, отраслевыми, религиозными, партийными и прочим) акторами, субъектами общества. В тоже время, наши исследования показали их недостаточную подготовленность и оснащенность как необходимыми техническими средствами, так и профессиональными статистическими кадрами при их колоссальной трудоемкости. Все эти проблемы разрешимы в условиях соответствующих специальных лабораторий в рамках БРИКС+ «Академии Ускоренного Роста и Мира», предлагаемой нашим проектом с минимальным финансированием на год 2 млн. долларов для 30-40 специалистов. Сами процессы сферного агрегирования традиционных статистических показателей в сферные легко поддаются автоматизации в рамках цифровых технологий, которые мы предлагаем для БРИКС+. Новые, сферные цифровые технологии обеспечат БРИКС+ новой, глобальной статистикой в дополнение к традиционной и откроют перед ним в целом и каждой его страной развитие принципиально нового направления "Сильного Искусственного Интеллекта Глобальной Статистики», пилотный проект которого создан в ГГСГ [9] и предлагается для БРИКС+. Новые технологии обеспечат БРИКС+ эффективную реализацию его ключевых целей ускоренного роста и глобального мира. БРИКС+ не должен упустить эту историческую возможность признать Гандианскую сферонику в качестве своей научной и теоретической базы, на которой были созданы эти технологии. Лучший и наиболее быстрый способ ее реализации – это создание в БРИКС+ ее небольшой Академии со многими практическими лабораториями, как это предлагает наш проект. 1. Gandhi Mahatma. My Religion, 1955, Chapter 36: https://www.mkgandhi.org/my_religion/36varna_caste.htm 2. Семашко Лев и ГГСГ. Махатма Ганди. Точка отсчета ненасилия. Генетика и статистика сферонов. Гандика. (Верификация сферонов и сфероники мировой статистикой, на четырех языках). СПб, 2019: https://peacefromharmony.org/docs/Makhatma-Gandi-Tochka-otscheta-nenasiliya_-Genetika-i-statistika-sferonov_-GANDIKA-2019.pdf 3. Йоханнесбургская декларация-II. БРИКС и Африка: партнерство в интересах совместного ускоренного роста, устойчивого развития и инклюзивной многосторонности, Сэндтон, Гаутенг, ЮАР, 23 августа 2023 года: https://www.mid.ru/ru/foreign_policy/news/1901504/?lang=ru 4. BRICS’s Priority: "To Strengthen of International Peace and Security". September 24, 2015: http://peacefromharmony.org/?cat=en_c&key=632 5. Лев Семашко, Ольга Кашина. Методика верификации сферонов на любом социальном объекте за 2 часа в рамках Сфероники. 2022: https://peacefromharmony.org/?cat=ru_c&key=998 6. Stephen Amoah and Ayo Ayoola-Amale. Ghana: Spherons’ Statistics, 1984, 2000 & 2010. 2019: https://peacefromharmony.org/?cat=en_c&key=836 7. Ghana Statistical Service. GSS (2012). 2010 Population and Housing Census Economic Activities in Ghana. 8. Ghana Statistical Service. GSS (2013) 2010 Population and Housing Census National Analytical Report. 9. Лев Семашко, Ольга Кашина. Сфероника: искусственный интеллект глобальной статистики и лидерства России. Январь 2023: https://peacefromharmony.org/?cat=ru_c&key=1015 + Стартап: https://peacefromharmony.org/docs/Заявка_Стартап_Утвержденный_С1ИИ-300867-3_С откликом_05-02-23.pdf Стивен Амоа, Член правления GGHA-Африка, Магистр статистики, доктор философии по прикладной статистике, Статистическая служба Ганы (GSS) с 1992 года. Руководитель отдела статистической координации, Профессиональный опыт работы в статистике более 30 лет, Веб-сайт: https://peacefromharmony.org/?cat=en_c&key=837, Емайл. steveamoah@gmail.com, Домашний адрес: Аккра, Гана. 03-10-23
---------------------------------------------------------------------
CV Name: Stephen Kwaku Amoah: Date of Birth: 4th May 1960. Email: stephen.amoah@statsghana.gov.gh, steveamoah@gmail.com Education: MSc Statistics (Univ. of Cape Coast), BSc Statistics and Psychology (Univ. of Ghana, Legon). Employment and Position: Ghana Statistical Service (GSS) and Head of Statistical Coordination and Capacity Building Unit. Work Experience: Worked with the GSS beginning 1992 to date. At the GSS worked with the Census and Survey Organisation Unit, Head of Vital Statistics Unit and Head of a Regional Office. Was seconded to the Births and Deaths Registry as Registrar of Births and Deaths Ghana (2007-11). Currently at GSS as Head of Statistical Coordination and Capacity Building Unit and National Coordinator of Civil Registration and Vital Statistics (CRVS) systems improvement in Ghana. Other Experience: Invited to assist in the organization of Statistics Courses (Statistics for Social Policy, National Accounts) by the Munich Centre for Economic, Environmental and Social Statistics, Germany in 2002 and 2004 for participants from Africa, Caribbean and Pacific countries. Research Experience: Been involved in a number ofCensuses and Surveys including population and housing Censuses (2000 and 2010), Multiple Indicator Cluster Surveys (2006, 2011), Living Standard Surveys(1998,2006, 2012), Demographic and Health Surveys, Child labour Survey, CRVS systems assessment etc.. Roles played in these censuses and surveys include reviewing of manuals and questionnaires, training and monitoring of field personnel, and writing final reports and dissemination of the reports. Some Conferences, Workshops and Seminars Attended ·CRVS systems improvement. Partners meeting. New York-2017. ·ID4Africa movement conferences. Rwanda - 2016, Namibia-2017. ·Ministerial Conferences on CRVS systems improvement in Africa: Cote d’Ivoire-2015, Ethiopia-2010, South African-2012. ·Training of selected personnel to support countries conduct assessment of their CRVS systems-Botswana-2013. ·African Symposium on Statistical Development Conferences (ASSD): Cape Town - 2012, Gabon 2015. ·Roundtable discussion on CRVS. Side-event in the UN Statistical Commission 41st session: New York-2010 Leisure and Interest Community work, playing music and travel. Referees 1.Professor NNN Nuamah Rector, Regent University Accra, Ghana. 2.Dr. Grace Bediako, Consultant, National Development Planning Commission, Accra, Ghana 3.Dr. Philomena Nyarko, immediate past Government Statistician, Ghana Statistical Service, P.O. Box 1098 Accra.
------------------------------------------------------------------------------ Global Peace Science: Structural Harmony of Spherons and Statistics of Ghana’s Spherons for 2010, 2000 and 1984 By Stephen Amoah and Ayo Ayoola-Amale AbstractThis study is the application ofthe Spherons (spheral macro classes) theory of tetrasociology to analyze the 2010, 2000 and 1984 Ghana population and housing census statistics of the country taking into consideration the population spheral classes to provide insights on macro employment in the country. Specifically, the study investigated the population macro structure in terms of its spheral classes using spheral indices to express the spherons. The purpose of our statistical study was to define the macro distribution of Ghana’s population based on its spheral classes and their dynamics in 2010, 2000 and 1984. The analysis showed a disharmonious distribution favoring the socioclass and technoclass within the overall spheral classes’ picture in comparison with the orgclass and infoclass. Of the two macro groups in the socioclass, the non-working population far outstripped the working population. An in-depth study of the dynamics of the spheral classes of a country, allows revealing profound social contradictions that can lead to the armed conflicts. Conscious regulation therefore ensures their prevention and lead to peaceful life of the population. The questions of statistics of spherons, their dynamics and indices are new for the social sciences and at the same time very important for them, especially for the economy and for ensuring peace at all levels. Keywords: Spherons, tetrasociology/sociocybernetics, spheral indices, autopoiesis, spheral classes Contents IntroductionThe global search for development and peace among nations has led to the proposal of various strategies with the ultimate goal of achieving harmonious stability of humanity and every society. The Spherons discovery and the statistical study of them identified by the tetrasociology/sociocybernetic conception [11; 12; 12a; 14 etc.], which places the right emphasis on human security and peace, holistically, covers the entire society with all its resources: people, information, organisation and things including environment. This understanding of human security and peace, as against the traditional concept of protection of national borders and investment in military readiness [13], is the emerging model for resolution of the conflicts that have evolved over the centuries. The line of reasoning of the Spheron’s theory is, if humanity align itself to the tetrasociology /sociocybernetic concept, humanity stands the chance to experience the peace from harmony that has eluded it earlier. The Spherons theory promises to bring the ultimate goal of harmonious and peaceful development of humanity and every society as it focuses on people and provides the real macro picture of the distribution of people on the Spherons and social resources between them. This ensures the achievement of structural harmony in the effective decision making all partial conflicts. The study of the Spherons of Russia [12] has brought out issues for the right scientific understanding of global and national peace. In our study of Ghana’s Spherons, we seek to apply similar approach to the dynamics of Ghana’s population through its macro spheral classes and vis-à-vis the labour market. Objective of studyTo study the demographic structure of the population of Ghana in terms of its spherons or spheral classes and its dynamics in a first approximation in the three time points. Data and MethodologyThe main data sources for this study are the 1984, 2000 and 2010 Population Census of Ghana (PCG) [1] [2] [3] with emphasis on the 2010 census. The study involved desktop review and analysis of the census documents by applying the Spherons methodology and spheral indices to express the statistics. Data LimitationsThe period of conducting a census is of great importance in the census undertaking. The 2010 census was conducted in the months of September and October. All the other censuses in the post-independence era were carried out in the month of March. This is worthy of note because it might also affect the classifications of the economically active population as well as the type of activity in which they are engaged given seasonal differences in employment opportunities. The categories of occupation and industry in the 1960, 1970, 1984 and 2000 censuses were different from those in the 2010 census given recent revisions and the introduction of new categories. In the 2010 census for example, occupation categories such as “elementary occupation” and “craft and related trade workers” were introduced. Similarly, industry groups such as “accommodation and food service activities” and “information and communication” were introduced to reflect changes in the economy. For this reason, there are differences in the employment categories and industrial sectors between the 2010 census and the previous ones. Definitions SPHERONS. “Spherons” or “spheral classes of the population” can be defined as the extremely large groups of people covering population in a whole and employed in four spheres or spheral categories/sectors of social production. These spherons produce in these spheres the appropriate extremely large groups/categories of social resources/products:People, Information, Organisation and Things (PIOT) and therefore they differ on the main (on time) employment in one of the spheres with one of these resources/products[11; 12; 12a]. SPHERES OF PRODUCTION. The Spherons’ theory distinguishes four spheres of production, which are defined as: 1. Social sphere or Sociosphere (S): The subject and product of which are people (P); 2. Information sphere or Infosphere (I): The subject and product of which is information (I); 3. Organization sphere or Orgsphere (O): This sphere has organisation (O), management, politics, law, finance, defense etc. as its subject and product; 4. Technical (economic/environmental) sphere or Technoecosphere (T): The subject and product of this sphere are the things including all material goods and services (T). All four spheres together are referred as “SIOT”, in which are employed four Spherons “SIOT-classes”, who produce in them the “PIOT” spheral resources/products. The “PIOT” spheral resources/productsare expressed by the special “spheral indices”. The first from them are the spheral indices of the Spherons [11; 12; 12a]. The Spherons spheral indices are the main subject ofstatistical research here and in all similar studies. EMPLOYMENT TWO CLUSTERS. Employment/occupation, in its multidimensional topology has two principal clusters: (1) Self production or ‘autopoiesis’ [9] and (2) Labor or economic employment of people by other resources except own “I” or “Myself”. 1. Self-production or ‘autopoiesis’ is explained as employment of each person by himself from birth to death.in processes such as eating, sleeping, learning, communication, recreation etc. Autopoiesis belongs only to Sociosphere because it includes all kinds of human activity except economic/labor activity. The term was introduced by Umberto Maturana and Francisco Varela (1973) [9] for theoretical biology to describe the self-reproduction of living cells. Niklas Luhmann in 1990 [8] reinterpreted the term in sociology to describe characteristics of human communication as the key element of social system. 2. Labor or economic employment of people by other resources except “I”. This is formally established within norms of labor activity of society. The labor activity is a part of self-production known as “seniority (work experience)” or “experience of labor activity”. It is part of each person’s life. The two clusters of employment divide the entire population into two parts: (1)Nonworking (economically inactive) population employed in Sociosphere by self-production (2)Working or economically active population employed in all spheres. The Spheral indices of the Spherons The spheral indices, which are used to express the SPHERONS, are defined as follows: Table 1. Spheral indices of Spherons P | Population/people in general for any level and community from family, school and town up to country and the world. | P1 | Socioclass, Spheron-1, who are employed in the branches of sociosphere (first sphere); | P1n | Non-working population, who are employed in self-production (‘autopoiesis”, Maturana [10])of sociosphere and forming the Spheron-1first part; | P1w | Working population in the branches of Sociosphere and who constitute the Spheron-1 second part. Therefore, P1 = P1n + P1w; | P2 | Infoclass, Spheron-2, who are employed in branches of Infosphere (second sphere); | P3 | Orgclass, Spheron-3, who are employed in branches of Orgsphere (third sphere); | P4 | Technoclass, Spheron-4, who are employed in branches of Technosphere (economic, fourth sphere). |
Each spheral class is a separate SPHERON covering part of the population employed in one of the four spheres of social production. In sum, the number of people of the four SPHERONS is the total population. This is expressed by the formula: P =P1 (P1n + P1w) + P2 + P3 + P4 or Population/People= Spheron-1 (nonworking + working) + Spheron-2 + Spheron-3 + Spheron-4. This is the fundamental formula of the population/people of any community from the family, town, and country to humanity as a whole in the Spherons spheral indices. The principal advantage and excellence of the spheral indicators is that they ensure the global digitalization of all national statistical indices, constitute their common denominator, logically organize/systematize/integrate them and open the way for the digital economy, for digital global peace through digital/conscious prevention of all wars and nonviolent resolution of all conflicts. The spheral indices aggregate the indices of traditional statistics on special technology that goes beyond the boundaries of our study. These questions are not discussed here, because they have been studied in detail in previous works [11; 12; 12a]. Employment and Unemployment Statistics, Ghana 2010 PHC Ghana’s population at 2010 was 24,658,823 with a total of 5,467,136 households of which more than half (55.8%) are in urban areas. The average household size was 4.4. The Census covered three different population groups: (1) household population; (2) non-household (Group Quarters/institutional) population; and (3) Out-door sleepers/floating population. Majority of household heads (76.6%) were economically active (GSS, 2012) [3; 4; 5]. Ghana’s population has a youthful structure with a broad base consisting of large numbers of children and a conical top of a small number of elderly persons. The 2010 Census indicated the population under 15 years constituted 38.5%. Population 15-24 years constituted 20.0%, population 25-59, constituted 35% and population 60+ years, 6.7 percent. The three most common occupations that household heads engaged in were: agriculture, forestry and fishery; services and sales; and craft and related trades. Agriculture is more popular in rural localities for both male and the female household heads. The service and sales sector is more popular among urban household heads. Most household heads are self-employed in the private informal sector of the economy, with a minority in the private formal and public sectors as employees. The statistics on employment and unemployment on Ghana’s population was mainly obtained from the 2010 population and housing census conducted by the country. Definition of employment and unemployment was based on ILO regulations on labor statistics. The age for employment used in the Census was 15-65 years. The 2010 PHC defined employed population as comprising of the following: •The population that worked •The population that did not work but had job to go back. •The population that did voluntary work without pay. The unemployed population was defined as comprising of: •The population that worked before seeking work and available for work. •The population seeking work for the first time and available for work [3; 4; 5]. Table 2. Employed and unemployed population by sex, 2010 PHC Status | Population | Male | Female | Employment | 10,939,923 | 5,372,379 | 5,567,544 | Unemployment* | 579,743 | 256,825 | 323,918 | *The unemployed population was defined as persons 15+ years who had no fixed job, not seeking for job and not available for work. |
Classification by branches of economic activity and categories of personnel.Definitions and Concepts. Economic Activity The question on economic activity was asked of all persons five years and above who engaged in any activity for pay (cash or kind) or profit or family gain for at least one hour during the seven days preceding census night. Economically active population The economically active population was defined as persons who: ·Worked for pay or profit or family gain for at least one hour within the seven days preceding census night. This category of persons included those who were in paid employment or self-employment or contributing family workers; ·Did not work, but had job to return to; ·Were unemployed and actively looking for work. Economically not active population The economically not active persons were those who did not work and were not seeking for work. The category included homemakers, full time students, retired persons, the disabled and persons who were unable to work because of their age or ill-health. Labour force The labour force comprised employed persons who had jobs or businesses and the unemployed. The term economically active population by the census definition was the same as the labour force. Therefore, these terms are used interchangeably in the chapter as appropriate. Workforce (the employed) Workforce represents the total number of workers actively employed, or available for work. It consisted of all persons aged 15 years and above, who during the reference period, were in the following categories: ·At work, that is, persons who during the reference period performed some work for wage or salary either in cash or in kind or worked without pay. ·Had a job to go back to, but did not work within the reference period. The Unemployed This comprises all persons aged 15 years and above, who during the reference period were: ·Without work and had no fixed jobs; ·Currently available for work; ·Seeking for work by taking specific steps to look for work (e.g. writing applications, visiting job sites, visiting employment agencies and seeking help from friends and relatives in the search for jobs Classification of economic activities The classification of economic activities in the 2010 PHC was done using the International standard classification of All Economic Activities (ISIC) revision 4 [8]. The ISIC rev 4 is the international reference classification of productive activities. Its main purpose is to provide a set of activity categories that can be utilized for the collection and reporting of statistics according to such activities.
Table 3: Economic Activities
SECTION | DESCRIPTION OF ECONOMIC ACTIVITY | A | Agriculture, forestry and fishing | B | Mining and quarrying | C | Manufacturing | D | Electricity, gas, stream and air conditioning supply | E | Water supply, sewerage, waste management and remediation activities | F | Construction | G | Wholesale and retail, repair of motor vehicles and motorcycles | H | Transportation and storage | I | Accommodation and food service activities | J | Information and communication | K | Financial and insurance activities | L | Real estate activities | M | Professional, scientific and technical activities | N | Administrative and support service activities | O | Public administration and defense, compulsory social security | P | Education | Q | Human health and social work activities | R | Arts, entertainment and recreation | S | Other service activities | T | Activities of households as employers, undifferentiated goods –and services – producing activities of households for own use | U | Activities of extraterritorial organizations and bodies |
The 2010 PHC used the International Standard Classification of Occupation (ISCO-08) as the basis for the national occupation classification. The ISCO-08 divides occupations into 10 major groups with each major group further organized into sub-major, minor and unit groups. The skill level and specialization required to competently perform the duties of the occupation are the basic criteria use to define the system. The major groups are as follows: Table 4.National Occupation Classification 0 | Armed forces occupations | Commissioned armed forces officers, non-commissioned armed forces officers and armed forces occupations, other ranks. | 1 | Managers | Chief executives, senior officials and legislators. Administrators and commercial managers, production and specialized services managers. Hospitality, retail and other services managers | 2 | Professional | Science and engineering professionals, health professionals, teaching professions, business and administration professionals, information and communication technology professionals, legal, social and cultural professionals | 3 | Technicians and associate professions | Science and engineering associateprofessionals, health associate professionals, Business and administration professionals, legal social, cultura and related associate professionals, Information and communication technicians | 4 | Clerical support workers | General and keyboard clerks, Customer services clerks, Numerical and material recording clerks, other clerical support workers | 5 | Service and sales workers | Personal service workers, sales workers, persona care workers, protective services workers | 6 | Skilled agricultural, forestry and fishery workers | Market-oriented skilled forestry, fishery and hunting workers, subsistence farmers, fishers, hunters and gatherers | 7 | Craft and related trades workers | Building and related trades workers, excluding electricians, metal, machinery and related trades workers, handicraft and printing workers, electrical and electronic trades workers, food processing, wood working garment and other craft and related trades workers | 8 | Plant and machine operators, and assemblers | Stationary plant and machine operators, assemblers, drivers and mobile plant operators | 9 | Elementary occupations | Cleaners and helpers, agricultural, forestry and fishery laborers, laborers in mining, construction, manufacturing and transport, food preparation assistants, street and related sales and service workers, refuse workers and other elementary workers | Source: International Standard Classification of Occupation (ISCO-08) |
The above categories of staff were grouped into the four spheral classes. (1)Heads of organization and their structural units (services) constituted the Orgclass (P3) (2)Specialists, and those with higher and mid-level qualificationsand engaged learning and health care personnel constitute the Socioclass (P1w) (3)Specialists and employees involved in the preparation of information, documentation and accounting make up the Infoclass (P2). (4)Other categories of staff, except heads and employees involved in the preparation of information, documentation, accounting and service constitute the Technoclass (P4) Determining the number Spherons based on StatisticsIn determining the number of spherons of the employed, the statistical information of both the employed (economically active population) and the unemployed (economically inactive) from the 2010 PHC was applied as follows. ResultsTable 5. Personnel Categories Economic Activity | | Personnel Categories | | | P1w | P2 | P3 | P4 | Economic Activities – Table 3 | 1,011,670 | 139,823 | 230,184 | 8,866,310 | | | | | | |
The mid-year population of Ghana for 2010 The mid –year population of Ghana (24,512,104) was computed using the component method. The estimate used the census definition of people who are “usually resident” in Ghana (Those present at the census night). The estimates roll forward the population found by the previous census (2000), one year at a time by accounting for births and deaths. Net migration was assumed to be zero.
Number of non-working population (P1n) in Ghana, 2010
The economically not active persons were those who did not work and were not seeking for work. The category included homemakers, full time students, retired persons, the disabled and persons who were unable to work because of their age or ill-health. Table 6. Employed self-production (non-working, economic inactive).
P1n | P1n = Employed self-production, sum of non-working, economic inactive | 14,410,836 | 100 % | | Did home duties (household chores/full time homeworker) | 1,308,455 | 9.1 | | In full time education / student | 6,480,996 | 45.0 | | Pensioner / Retired | 143,105 | 1.0 | | Disabled / Too sick to work | 222,649 | 1.5 | | Too old / Too young | 5,873,446 | 40.8 | | Other | 382,185 | 2.7 |
Extracted from Ghana 2010 PHC Report (www.statsghana.gov.gh) SPHERONS in Ghana, 2010 Table 7. Number of SPHERONS of Population in Ghana for 2010 Spheral Indices | The employed in branches of Four Spheres | 2010 | % | P | All population of Ghana: P= P1+P2+P3+P4 | 24,658,823 | 100 | P1 | SOCIOCLASS, Spheron-1: P1= P1w + P1n | 15,422,506 | 62.5 | P1w | P1w = Sum of employed (working) in the branches of Sociosphere | 1,011,670 | 4.1 | | PEDUCATION | 409,694 | 1.7 | | QHEALTH AND SOCIAL WORK | 125,254 | 0.5 | | SOTHER COMMUNITY,SOCIAL& PERSONALSERVICE ACTIVITIES | 476,722 | 1.9 | P1n | P1n = Employed of Self-Production , sum of nonworking | 14,410,836 | 58.0 | | Did home duties (household chores/full time homeworker) | 1,308,455 | 5.3 | | In full time education / student | 6,480,996 | 26.3 | | Pensioner / Retired | 143,105 | 0.6 | | Disabled/Too sick to work | 222,649 | 0.9 | | Too old / Too young | 5,873,446 | 23.8 | | Other | 382,185 | 1.5 | P2 | INFOCLASS, Spheron-2: = Sum of employed in the branches of Infosphere: | 139,823 | 0.6 | | COMMUNICATION | 43,600 | 0.2 | | Science and Scientific Services | 96,223 | 0.4 | P3 | ORCLASS, Spheron-3: = Sum of employed in the branches of Orgsphere: | 230,184 | 0.9 | | OPublic Administration & Defense | 154,559 | 0.6 | | KFinancial Intermediation | 72,666 | 0.3 | | UActivities of extra territorial organization | 2,959 | 0.0 | P4 | TECHNOCLASS, Spheron-4: = Sum of employed in the branches of Technosphere: | 8,866,310 | 36.0 | | AAgriculture, Forestry & Fishing | 4345,723 | 17.6 | | BMining & Quarrying | 115,394 | 0.5 | | CManufacturing | 1,135,612 | 4.6 | | DElectricity & Gas | 16,237 | 0.1 | | FConstruction | 321,360 | 1.3 | | GWholesale & Retail Trade | 1,981,290 | 8.0 | | IAccommodation & Food | 574,671 | 2.3 | | HTransport & Storage | 371,461 | 1.5 | | LReal Estate | 4,562 | 0.0 |
Source: Ghana 2010 PHC Report SPHERONS in Ghana, 1984 and 2000
Table 8. SPHERONS of Ghana’s population for the 1984 and 2000.
Spheral Indices | The Employed in Branches of Four Spheres | 1984 | 2000 | 2000/% | P | All Population of Ghana: P = P1+P2+P3+P4 | 12,296,081 | 18,912,079 | 100 | P1 | SOCIOCLASS, Spheron-1: P1= P1w + P1n | 9,653,493 | 13,566,411 | 71.7 | P1w | P1w = sum of employed (working) in the branches of Sociosphere: | 2,428,112 | 2,330,907 | 12.3 | | PEDUCATION | 1,287,885 | 2,007,043 | 10.6 | | QHEALTH AND SOCIAL WORK | 787,885 | 174,140 | 0.9 | | SOTHER COMMUNITY,SOCIAL& PERSONALSERVICE ACTIVITIES | 352,342 | 149,724 | 0.0 | P1n | P1n = Employed of self-production, sum of non-working, economic inactive: | 7,225,381 | 11,235,504 | 59.4 | | Homemakers | 1,702,231 | 4,941,182 | 26.1 | | student | 3,631,108 | 4,436,230 | 23.5 | | Vocational Trainees | 10,987 | 647,629 | 3.4 | | Income Recipients | 17,919 | 62,379 | 0.3 | | Old age | 1,287,885 | 333,050 | 1.8 | | Retired / Pensioner | 287,885 | 145,807 | 0.8 | | Persons with disability | 159,712 | 94,401 | 0.5 | | others | 415,539 | 574,826 | 3.0 | P2 | INFOCLASS, Spheron-2: = sum of employed in the branches of Infosphere: | 796,375 | 2,223,541 | 11.8 | | COMMUNICATION | 8,490 | 1,737,541 | 9.2 | | Science and Scientific Services | 787,885 | 486,000 | 2.6 | P3 | ORCLASS, Spheron-3: = sum of employed in the branches of Orgsphere: | 121,292 | 150,150 | 0.8 | | OPublic Administration & Defence | 97,548 | 105,764 | 0.6 | | KFinancial Intermediation | 21,915 | 40,386 | 0.2 | | UActivities of extra territorial organization | 1,829 | 4,000 | 0.0 | P4 | TECHNOCLASS, Spheron-4: = sum of employed in the branches of Technosphere: | 1,724,921 | 2,971,977 | 15.7 | | AAgriculture, Forestry & Fishing | 117,529 | 302,505 | 1.6 | | BMining & Quarrying | 26,828 | 103,662 | 0.5 | | CManufacturing | 588,418 | 788,068 | 4.2 | | DElectricity & Gas | 15,437 | 26,409 | 0.0 | | FConstruction | 64,686 | 232,611 | 1.2 | | GWholesale & Retail Trade | 774,157 | 1,119,395 | 5.9 | | IAccommodation & Food | 17,990 | 169,274 | 0.9 | | HTransport & Storage | 114,316 | 217,485 | 1.1 | | LReal Estate | 5,560 | 12,568 | 0.0 |
Conclusion and DiscussionGenerally, the larger the employed population, the more wealth is created leading to the general well-being of the population. In Ghana, over the years, a number of job opportunities have been created in the public and private sectors in a wide range of economic activities. Contributing to employment opportunities in any country or area are factors such as the structure of the population, proportion of the economically active population and the labour market. Our research of the Ghana’s spherons identified the four production spherons of Ghana and the employment status of its citizens in each spheral class. The study shows that, at 2010, the population size of Ghana’s Socioclass (Spheron-1, P1) constituted the highest proportion (62.5%) of the employed in all four spheres. This was followed by the Technoclass (Spheron-4, P4) employing 36.0%, the Orgclass (Spheron-3, P3) with 0.9% and the Infoclass (Spheron-2, P2) with 0.6% in that order. Table 6 shows the employed by self-production, "autopoiesis", in accordance with the theory of Maturana [9] and its sociological interpretation of Luhmann [8]. This is a non-working, economically inactive group, but it is very important socially, preparing a human resource for economic activity or providing its exit from it by age or health.The highest proportion in this group is made up of full time persons in education / students (45.0%), followed by persons considered as too old or too young (40.8%) and those who did home duties household chores/full time homeworker (9.1%). The disabled/too sick to work, pensioners/retired and other constituted 1.5%, 1.0% and 2.7% % respectively. Table 7 shows the distribution and size of the spherons as determined by the employed statistics of the 2010 PHC and the spheral indices. Overall, the employed population (P) in Ghana at 2010 was 24,658,823. The Socioclass (P1), made up of working (P1w) and non-working (P1n) employed the highest number of people (62.5%). This figure is made up of 4.1 % (P1w) economically active (working) population and 58.0 % (P1n) economically in-active or non-working population. This situation signifies a very unhealthy situation for the country. The table further shows the infoclass (P2) employed 0.6%, the Orgclass (P3) employed 0.9% and the Technoclass (P4) 36.0%. Table 8 also shows the distribution of Spherons in Ghana in 1984 and 2000. The table shows that in 2000 about 7 in 10 persons (71.7%) of the employed population were in the Socioclass (P1). Over the period (1984 to 2000), this Spheron (P1) employed the largest proportion of the population growing from 9,653,493 in 1984 to 13,566,411 in 2000, an increase of about 40 % in a period of 16 years. The non-working population (P1n) also increased from 7,225,381 to 11,235,504 within the period unlike the working in this sphere population (P1w), which dropped from 2,428,112 to 2,330,907. The overall increase in the socioclass (P1), however, favoured (P1n), the non-working class which increased by 56% while the working class (P1w), dropped by 4 % within the period. Table 8 again shows the Infoclass (P2) recorded an increase in numbers over the period 1984 to 2000 almost three times (796,375 to 2,223,541). At 2000 the Infoclass t constituted 11.8 % of the all employed population. The Orgclass (P3) also recorded an increase in numbers from 121,292 in 1984 to 150,150 in 2000. At 2000 this Spheron constituted 0.8 % of the employed population. The Technoclass (P4), recorded an increase in numbers within the period and formed 15.7% of the population in 2000. This is the second highest after the Socioclass Spheron. In sum, there is a steady increase in the population of Ghana, mainly due to the growth of the socioclass/spheron-1. In it, the increase in the number of non-working population (P1n) in comparison with the working population (P1w) in this and other spheres has been worrying for many years. This situation puts pressure on the working population, increasing, on the one hand, the workload on it, and on the other hand, reducing the opportunities of well-being for the non-working. Disproportions and disharmony in the dynamics of the Spherons’ number exacerbate the whole spectrum of social risks from economic and political to environmental and demographic. With the exception of an increase in employment in the technoclass (36.0%) for 2010 compared to 15.7% in 2000, there were declines in employment in the three other spherons (Infoclass, Orgclass and Socioclass) for 2010 compared to 2000. The growth in the number of technoclass in 2010 loses growth in employment in other spheres in 2010. This is a clear case of the spheral disharmony in the holistic structural system of Ghanaian spherons. This problem deserves the most intensive scientific research and close attention of the country's leadership. An in-depth research of Ghana’s spherons will provide fundamental information that is necessary to achieve an optimal balance in the structural harmony of Ghanaian spherons and spheres of social production. Achieving spheral balance and harmony will ensure the creation and harmonization of the necessary strategies for overcoming poverty, corruption and inequality. This will bring lasting peace and prosperity to the country. Of course, we understand that our first statistical research of Ghana’s spherons is only the first swallow and the initial step on the long journey of innovative statistical digital studies of Ghana's social production as a whole. only its holistic spheral research using spheral statistics and its universal digital technology (SIST [12]) will provide the country's leadership with a large-scale monitoring of the dynamics of all spheral imbalances and disproportions in the country. This will allow developing an effective long-term economic, political, demographic and social policy that prevents crises and conflicts in the framework of ensuring and strengthening a lasting sustainable peace from the structural harmony of Ghana’s spherons. To this end, the country needs priority investment and the development of appropriate scientific innovations and spheral statistical digital technologies. The same conclusion is for global peace. If such researches and their practical peacemaking consequences are obvious for separate countries, then they are adequate for other countries and for the gradual provision of global peace and prosperity of all nations on the basis of scientific knowledge and governance of the spherons’ structural harmony that generate them. References: 1.Ghana Statistical Service.GSS (1986). 1984, Population Census of Ghana, (The gazette 2). 2.Ghana Statistical Service.GSS (2004). 2000 Population Census of Ghana (The gazette 3). 3.Ghana Statistical Service. GSS (2012). 2010 Population and Housing Census Summary Report of final Results. 4.Ghana Statistical Service. GSS (2012). 2010 Population and Housing Census Economic Activities in Ghana. 5.Ghana Statistical Service. GSS (2013) 2010 Population and Housing Census National Analytical Report (2013). 6.Ghana Statistical Service. GSS (2016). 2015 Labour force report. http://www.statsghana.gov.gh 7.International Standard Industrial Classification of all Economic Activities (ISIC), Rev.4. United Nations publication. ISBN: 987-92-1-161518-0. 8.Paetau Michael (2013) Niklas Luhmann and Cybernetics. Journal of Sociocybernetics. Vol 11 No 1/2 (2013): https://papiro.unizar.es/ojs/index.php/rc51-jos/article/view/790 9.Maturana, Humberto & Varela, Francisco ([1st edition 1973] 1980). Autopoiesis and Cognition: the Realization of the Living. 10.Regions of Russia. Socio-economic Indicators 2013. Statistical Collection. M: 2013 11.Semashko, Leo (2002) Tetrasociology: Responses to Challenges. –St Petersburg: http://peacefromharmony.org/?cat=en_c&key=145 12.Kashina Olga and Semashko Leo (2014) Statistics of SPHERONS of Russia for 2010: Methodology, Sources and Number: http://peacefromharmony.org/?cat=en_c&key=593 12a. Semashko Leo and 173 coauthors from 34 countries (2016) Global Peace Science (pages: 51-60): http://peacefromharmony.org/docs/global-peace-science-2016.pdf 13.Takemi, K., Jimba, M., Ishii, S., Katsuma, Y., & Nakamura, Y. (2008). Human security approach for global health. The Lancet, 372(9632), 13-14. doi: 10.1016/s0140-6736(08)60971-x 14.Hornung Bernd, Scott Bernard, Semashko Leo (2003) Tetrasociology and sociocybernetics: Towards a comparison of the key concepts: http://www.peacefromharmony.org/?cat=en_c&key=160 Stephen Amoah, MSc Statistics, PhD Applied Statistics Ghana Statistical Service, Chief Statistician, Home address: Accra, Ghana Email: stephen.amoah@statsghana.gov.gh Ayo Ayoola-Amale, J.D. GHA-Africa President, GHA Int. Vice-President, Womens' GHA Co-Chair, Ghana University Professor, Nigeria & Ghana, Accra Email: aayoamale@gmail.com 30-07-18
------------------------------------------------------------------------------
Up
|
 Official Website")